|
home | what's new | other sites | contact | about |
||
|
Word Gems exploring self-realization, sacred personhood, and full humanity
Eternity and Infinity Fractals and the Mandelbrot Set
return to "Eternity and Infinity" main-page
Fractal – broken, fragmented, fractional, irregular A flowing and distinct coastline, from satellite view, disappears into a moving and disordered interaction of rocks and water, with no clear line of demarcation. Nature deals not with smooth-edged objects or straight lines but irregular fractals. The fractal provides a better tool for better description of the observable universe. It does so via intricate, simple, but repeatable formulas to represent the irregular and fragmented forms of nature.
See the video: Arthur Clarke's, Fractals: The Colours of Infinity See the video: The Mandelbrot Set Explained
from https://topdocumentaryfilms.com/fractals-colors-infinity/ The Mandelbrot set - someone has called it the thumb-print of God - is one of the most beautiful and remarkable discoveries in the entire history of mathematics. With Arthur C. Clarke as narrator and interviews with a number of notable mathematicians, including Benoît Mandelbrot, this program graphically illustrates how simple formulas can lead to complicated results: it explains the set, what it means, its internal consistency, and the revolutions in thought resulting from its discovery. Asked if the real universe goes on forever, Stephen Hawking defines its limit of smallness; the Mandelbrot set, on the other hand, may go on forever. The invention of the silicon chip in the 1970's created a revolution in computers and communication and hence transformed our way of life. We are now seeing another revolution which is going to change our view of the universe and give us a better understanding of its' working. This film will explore the fractal universe and on our voyage of discovery, we will be helped by: Professor Ian Stewart of the Mathematics Institute, University of Warwick, an author of over 100 published scientific works; Dr. Michael Barnsley, former professor of mathematics at Georgia Institute of Technology who received a 2.5 million dollar government grant in 1991 to develop a fractal image compression systems.
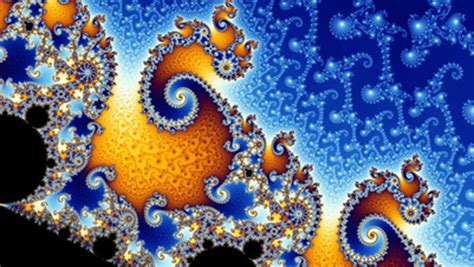
from https://besharamagazine.org/a-thing-of-beauty/mandelbrot-set-fractal-geometry/ How a Simple Equation Generates Unique ComplexityThis is because the astonishing patterns of the set are generated by a remarkably concise mathematical equation: Z = Z2 + C How such a simple formula can give rise to such intricate and exquisite patterns is explained in some detail, but in an easily understood way for the non-mathematician... The equation Z = Z2 + C is an iterative equation which generates a series of numbers. It says that each successive number is simply the square of the previous one plus a constant C. The sequence begins by setting Z to zero, so that the next Z has the value C (i.e. 02 + C). The following Z will be C2 + C, and so on. The complication is that the numbers in this equation are not the ordinary numbers everyone is familiar with. The Zs and C are ‘complex numbers’ which can be represented not as a point on a line or linear scale but as one on a two-dimensional graph. Though most of us do not think of numbers in this way, mathematicians do and have no trouble working with them. Just as with ordinary numbers the usual rules of arithmetic – like addition and multiplication – work for complex numbers. It is apparent that the series of numbers this simple equation generates depend on the choice of C. If we were working with ordinary numbers, for most Cs the Zs will get bigger and bigger. For example, if we begin with C = 1, the first Z will simply be 1, the second 12 + 1 = 2, the third 22 + 1 = 5, the fourth 26, etc. The sixth Z is already very big at 45,8330. However, there is a small range of values of C which result in the Zs being confined or bounded within a narrow limit. Starting with a value between negative 2 and positive 0.25, the successive values of Z will be trapped between -2 and +2. The same thing happens with complex numbers. Depending on where the first point on the graph is (i.e. C), the Zs either shoot off to infinity or become bounded. The beautiful patterns generated by the simple iterative equation simply show where numbers (the initial point, C) will get bigger or become bounded as it generates successive numbers. Numbers represented by a point on or within the black shapes will get trapped within them (this set of numbers is the Mandelbrot set). Points outside the black shapes will get bigger. What of the colours? Surely Z and C are colourless? The colours are indeed artificial. They are used in a way analogous to how colours can be used on maps to represent different heights. Here the colours represent how rapidly numbers outside the black shapes will accelerate toward infinity. Clearly this too depends on the starting point. To illustrate using just ordinary numbers: if we choose the first point, C, to be 1, then the third point in the sequence will be 5, But if we start with 5, then the first number will be 30 and the third 905. So the acceleration to infinity is far faster if we begin with 5 rather than 1. Measuring the speed with which the Zs expand and then attaching a colour to them is easy in theory, but in practice it is only possible with a computer, as the patterns we witness require the generation of many hundreds of numbers (or points) every second. The discovery of the Mandelbrot set required the invention of the computer so that it could be said: yes, a computer is useful but it can yield beauty.
|
||
|
|

